Climate Change in our Backyard
In September 2017, a statewide team of scientists released the first Montana Climate Assessment report - an excellent, detailed look at the ways our climate has changed and projections for the future, with a particular focus on impacts to agriculture, forestry, and water. Future reports will focus on other industries, including recreation and tourism.
The impacts of climate change can be hard to see and understand. Analyzing long-term trends and comparing historical conditions to current data tells us how our climate is changing. These long-term trends also influence the short-term variability of our weather from day to day and year to year. In Western Montana, we’ve already seen changes in our temperature and precipitation patterns. Click the links below to learn more about some of the local impacts of climate change.
The impacts of climate change can be hard to see and understand. Analyzing long-term trends and comparing historical conditions to current data tells us how our climate is changing. These long-term trends also influence the short-term variability of our weather from day to day and year to year. In Western Montana, we’ve already seen changes in our temperature and precipitation patterns. Click the links below to learn more about some of the local impacts of climate change.
Temperature
|
Water
|
Wildfires
|
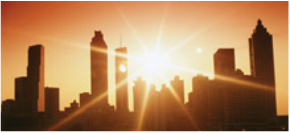
Rising Temperatures
In Missoula, the average annual temperature during the 20th century was 44.3 degrees Fahrenheit. But every year since 2000 has been above that average – by as much as 2.5 degrees in 2015.
Hotter average annual temperatures means summer temps are hotter too. Average June through August temperatures in Missoula over the period 2000 – 2015 were 2 degrees hotter than the 20th century average. Two degrees may not seem like much, but even a small temperature increase can have significant effects.
Source: NOAA Climate At a Glance
|
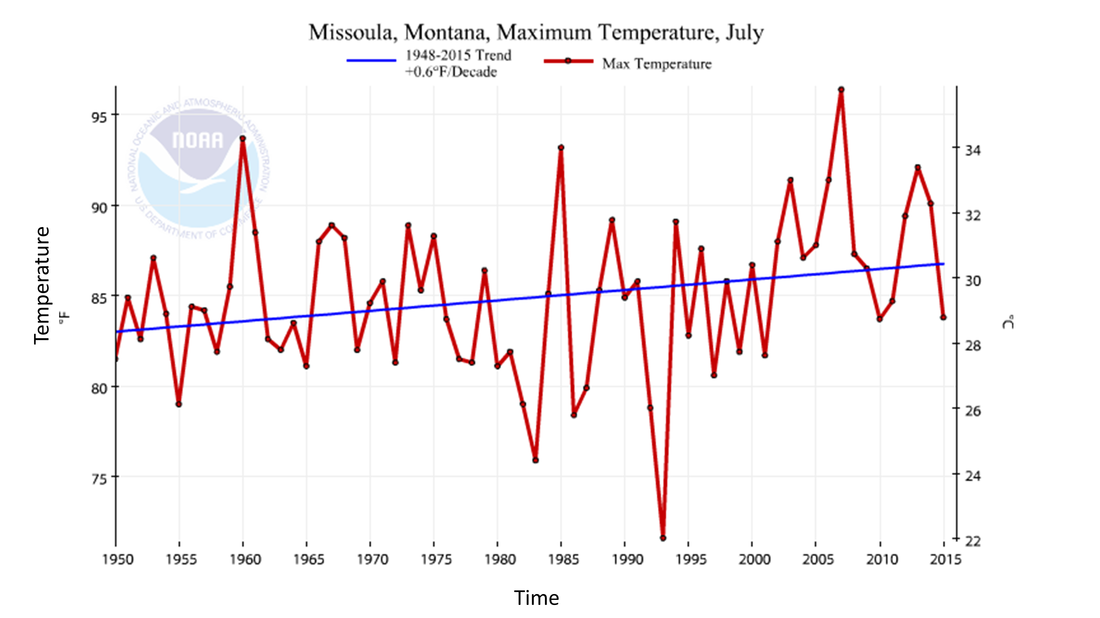
When the average temperature is higher, that means the extremes are higher, too.
During summer months, heat waves can be more intense. In July, for example, average high temperatures have been steadily increasing. (See the blue trend line in the graph to the left.) |
|
But nighttime temperatures are warmer too. It's not your imagination - we're not getting as much of a break from the heat overnight.
The upward sloping line on the graph to the right shows the trend of warmer average minimum temperatures during the summer. Public health officials warn that hotter nights can make heat waves even more dangerous. |
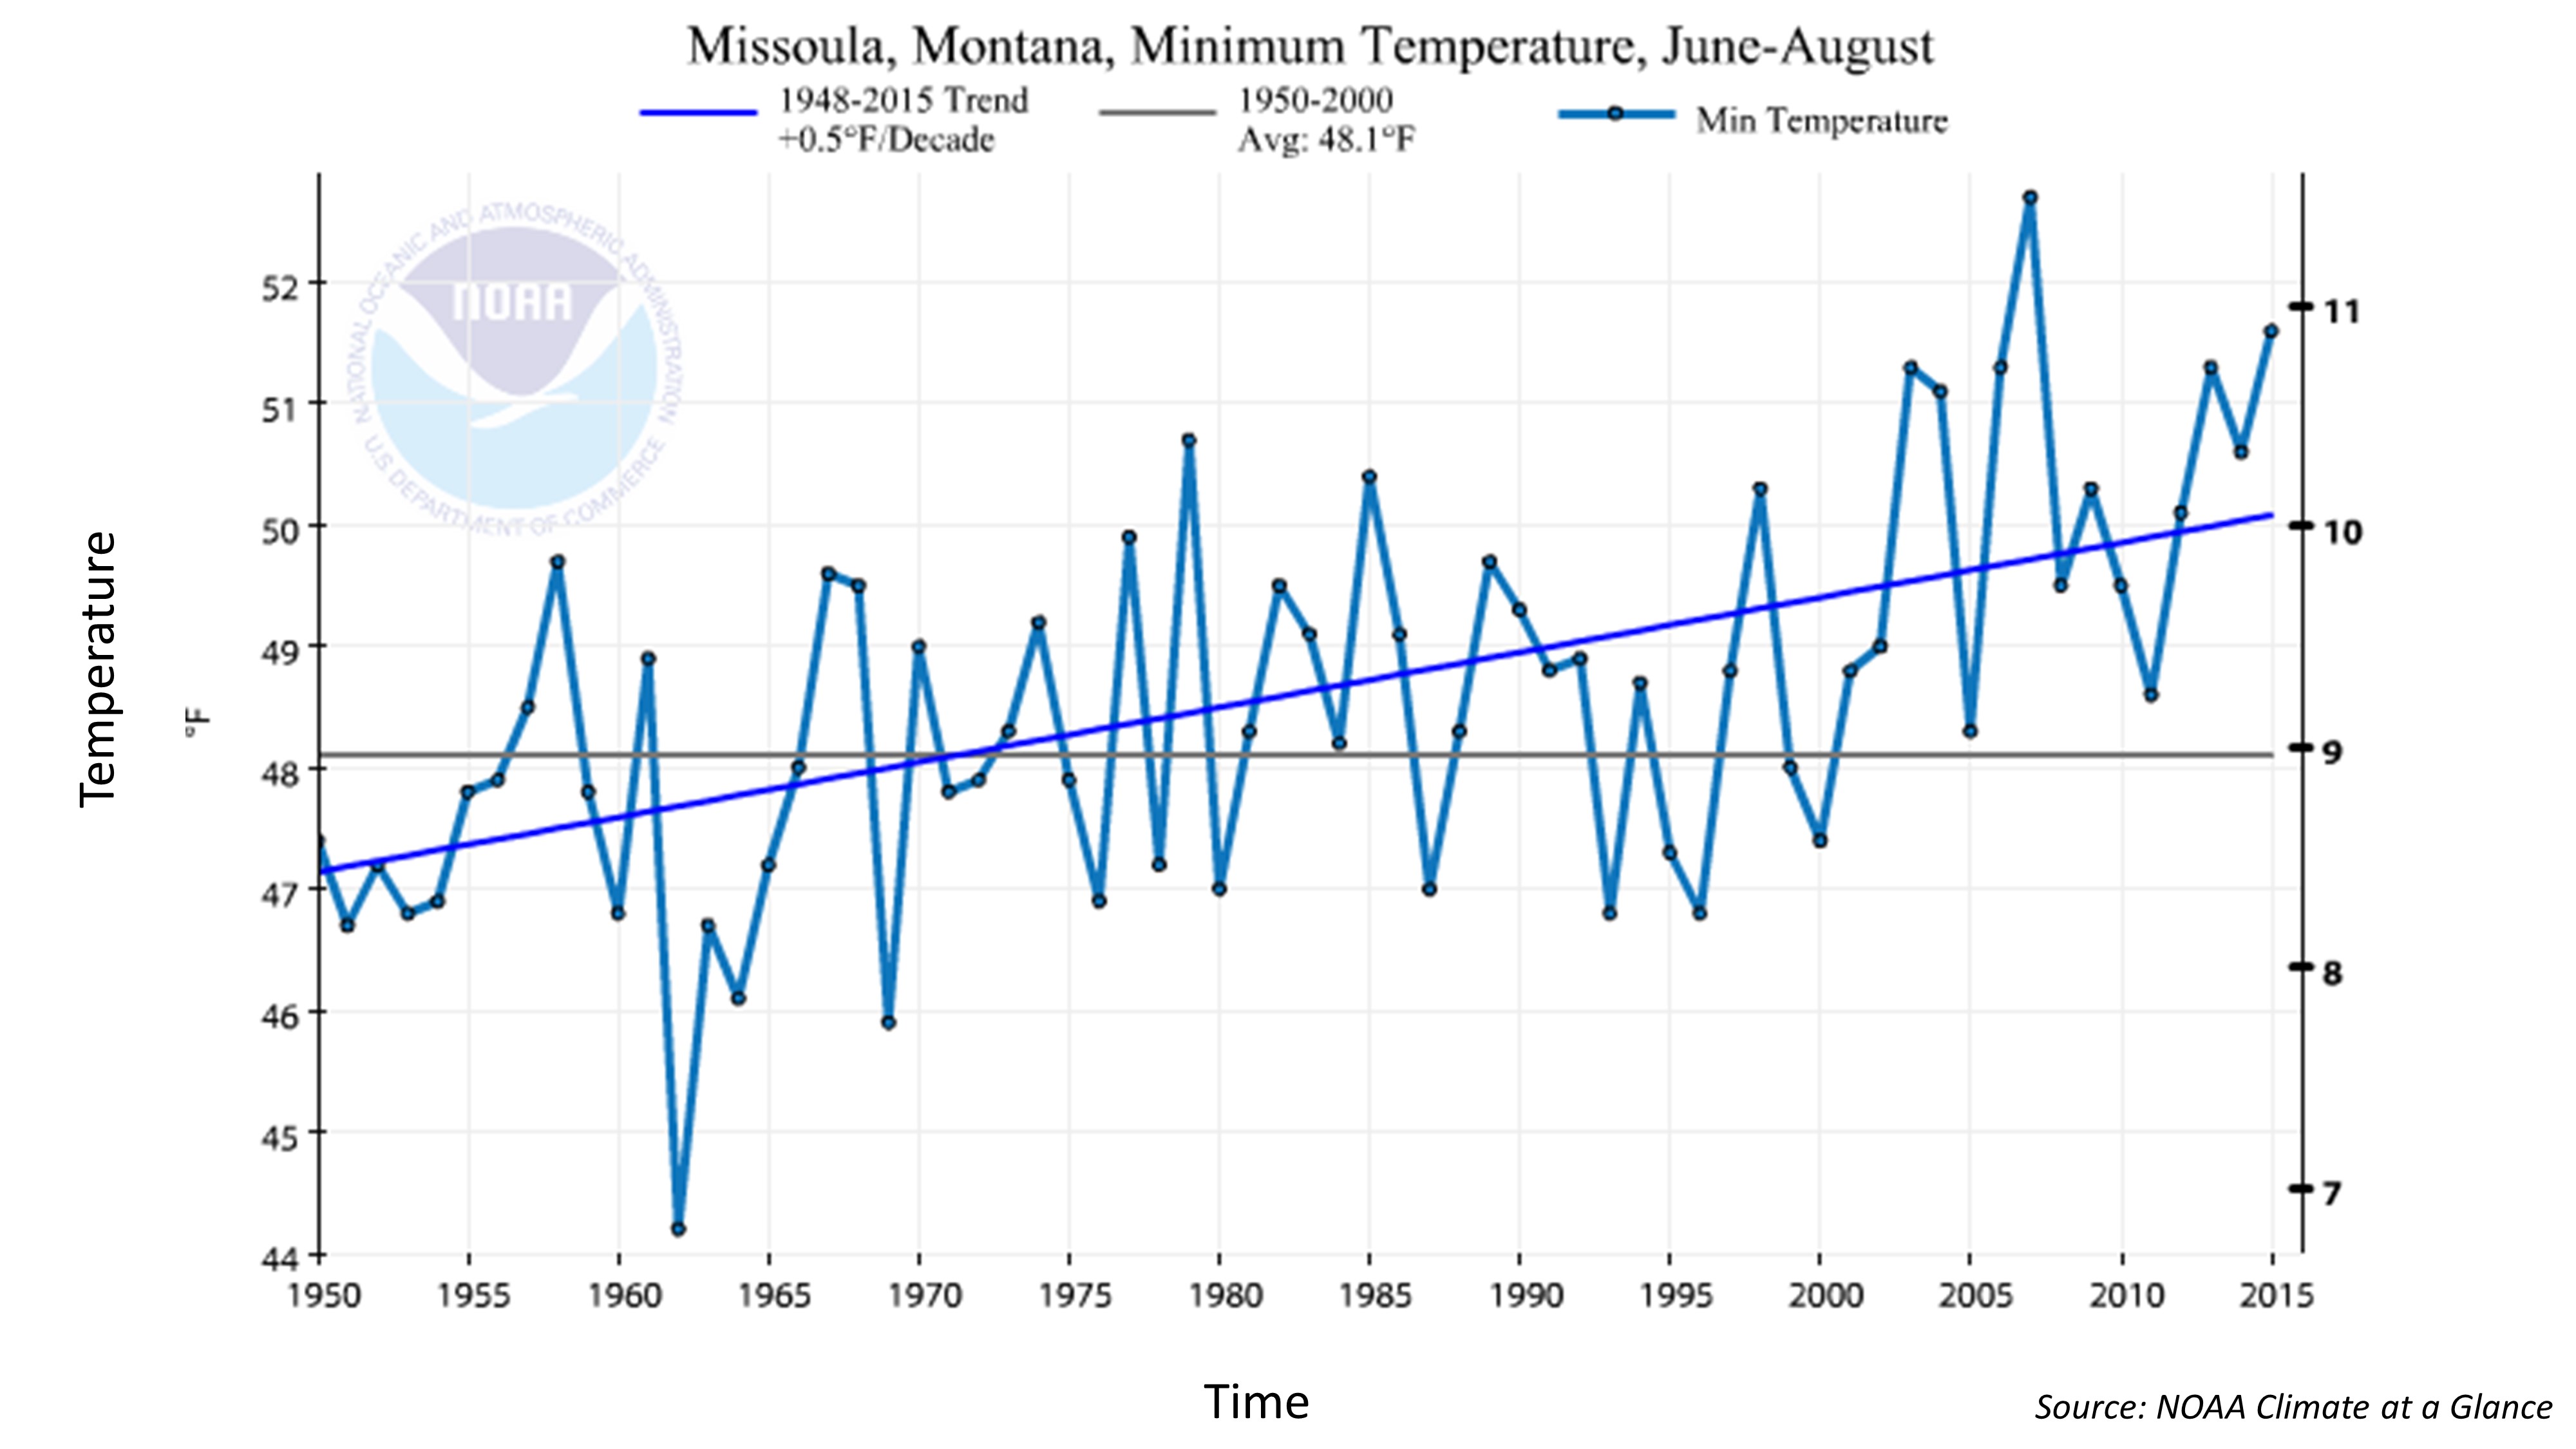
Source: NOAA Climate At a Glance
|
2015 was the hottest year on record here in Western Montana, coming in at a whopping 4.2 degrees F above the 20th century average. 2016 wasn't far behind, with an average temperature more than 3 degrees above the 20th century average. Globally, 2016 was the hottest year on record, and 2017 is shaping up to be another record-setting hot year.
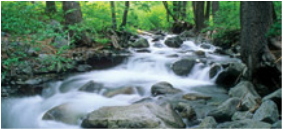
Snowpack and Precipitation
Changing rain and snowfall patterns across the entire Pacific Northwest impact our watersheds here in Western Montana. Here in Missoula, we haven't seen a statistically significant change in our total amount of precipitation. But as temperatures have increased, across our region more of our precipitation is arriving as rain instead of snow, which has a significant impact on our valley. Mountain snowpack is an important part of the water cycle, helping to store water needed for irrigation, drinking water, hydro-power, and more.
Reduced snowpack is a trend affecting the entire west, and especially the Pacific Northwest. At both lower elevations (2,000 to 5,000 feet), and higher elevations (above 5,000 feet), about two thirds of weather stations across Washington, Oregon, Idaho and Montana are seeing a lower percentage of winter precipitation falling as snow. Overall, 66 percent of Montana weather stations have seen an increase in rainfall as a percentage of winter precipitation. Roll over the map below (left) to see how we stack up to other states. All the red dots on the map below (right) indicate places where there's less snow - click through to see recent research on snowpack trends in the West.
Reduced snowpack is a trend affecting the entire west, and especially the Pacific Northwest. At both lower elevations (2,000 to 5,000 feet), and higher elevations (above 5,000 feet), about two thirds of weather stations across Washington, Oregon, Idaho and Montana are seeing a lower percentage of winter precipitation falling as snow. Overall, 66 percent of Montana weather stations have seen an increase in rainfall as a percentage of winter precipitation. Roll over the map below (left) to see how we stack up to other states. All the red dots on the map below (right) indicate places where there's less snow - click through to see recent research on snowpack trends in the West.
|
|
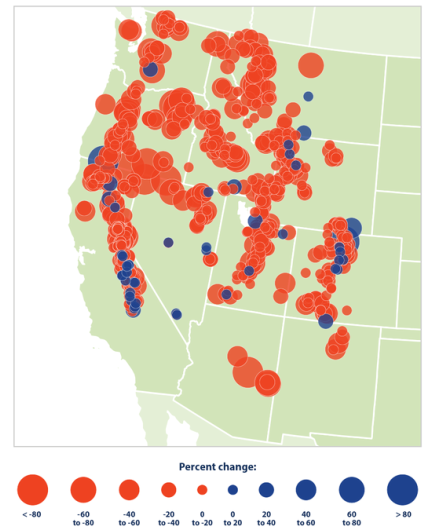
Source: US EPA
|
Warmer winters come with their own challenges – like icier ski slopes! But warmer and rainier winters also have a major impact on our summer conditions. It's challenging to predict precipitation patterns, but whether climate change brings wetter or drier conditions to our region in the future, warmer winters mean reduced snowpack and earlier spring runoff, which in turn means less water is available in the summer when demand is highest. Reduced snowpack also affects stream flows and water for irrigation, and contributes to more intense droughts and wildfires. Wondering what these dry conditions mean? We've got you covered - learn more about drought and wildfires.
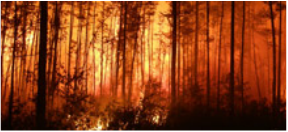
Wildfire Smoke and Air Quality
|
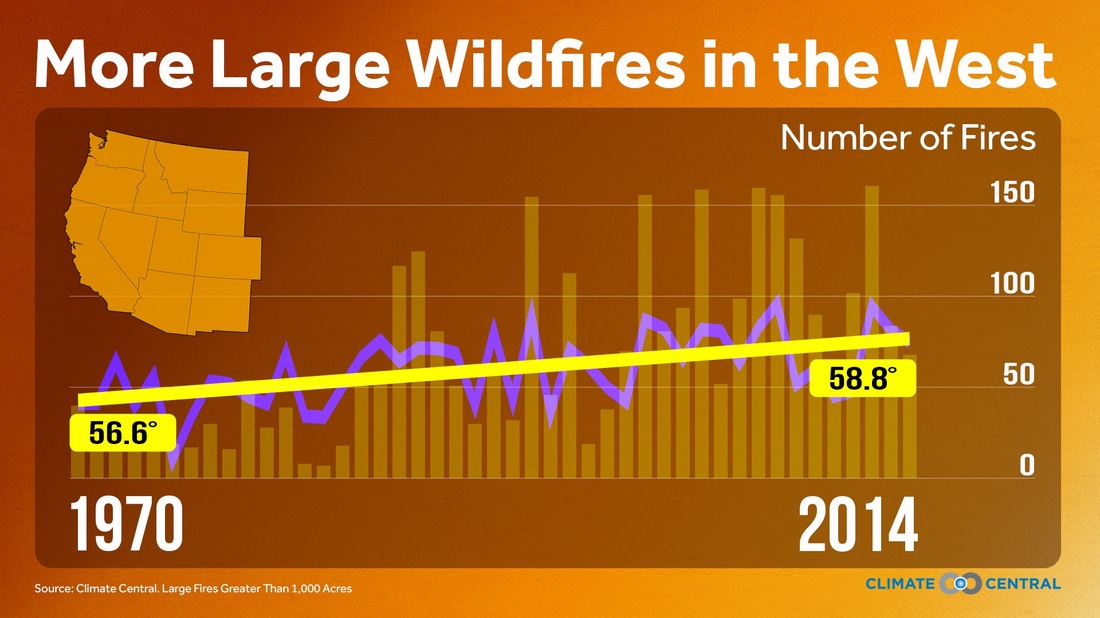
Hotter temperatures and earlier snow melt contribute to dry conditions that fuel wildfires. Here in the West, alongside increasing temperatures, the average annual number of large wildfires (fires over 1000 acres) has more than doubled since 1970, and wildfire season is now an average of 105 days longer. This trend is particularly extreme in the Northern Rockies, where large wildfires are 10 times more common and the area burned is up to 45 times greater.
The Missoula Independent has a recent (July 2017) in-depth article detailing the connections between climate and wildfires - check it out HERE. |
|
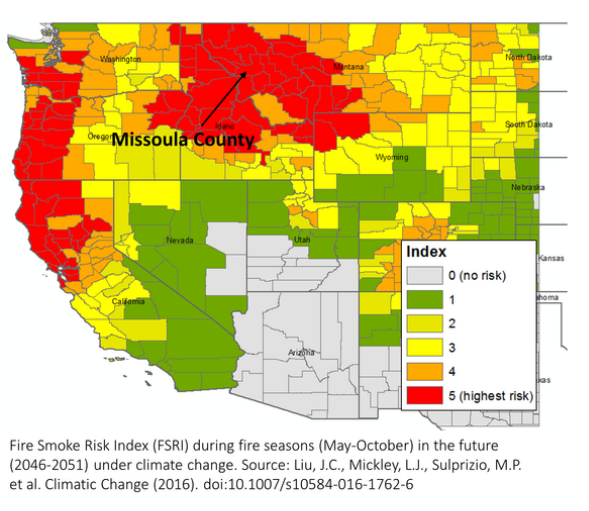
The graph above shows the annual number of fires (vertical bars) alongside the annual average temperature (purple line). In Missoula, our bowl-shaped valley traps wildfire smoke from as far away as California, contributing to poor summer air quality. Wood smoke contains high levels of fine particulate matter (PM 2.5), which can cause many adverse health impacts. (Learn more about smoke-related health issues here.) The American Lung Association ranked Missoula 10th worst out of 186 US cities in terms of number of days with high PM 2.5 concentrations, earning us a grade of “F”. Many of the days with the worst air quality have occurred during summer wildfire season. With more fires burning in the region, we can expect more smoky days in the future, as seen in the map below. (Check out the complete map of wildfire smoke risk by county and click on Missoula to see a comparison of current and projected future smoke intensity.)
Even when wildfires aren’t burning, hotter temperatures carry the possibility of increased amounts of ground-level ozone, making our air less healthy to breathe.
Even when wildfires aren’t burning, hotter temperatures carry the possibility of increased amounts of ground-level ozone, making our air less healthy to breathe.
What Will the Future Bring?
|
No one can predict future climate impacts with complete certainty, but climate projections for our region give us an idea of what to expect.
|
Researchers at the Montana Climate Office have just released the first Montana Climate Assessment, focused on climate impacts to agriculture, forests, and water resources. Check it out!
|
Climate Change: a Global Phenomenon
|
http://climate.nasa.gov/
|
These local impacts are just part of the bigger picture of global climate change. Heat trapped in Earth’s atmosphere by greenhouse gases impacts global climate patterns – so it makes sense to talk about global climate change and global warming. On a global scale, warming trends are clear as day. The average surface temperature across the planet increased by 1.6 degrees F from the 1880s to 2014. The 21st century continues to smash records left and right: not only was 2016 the hottest year on record globally, but 16 of the 17 hottest years have occurred since year 2000. August 2016 was the 16th month in a row to break all-time global temperature records - a record hot streak in itself. Check out this time-lapse from NASA (left) to see how temperatures have increased across the globe since the 1880s.
|
Wondering what summer climate impacts across the globe look like? Check out this recent photo essay that pulls it all together.
Dig Deeper into Local and Global Climate Conditions
Bummed about hotter and smokier summers? We've got lots of tips and ideas about how to "weather the weather": learn how to be summer smart when it comes to heat, smoke, shade, and more.
Interested in learning more about how our climate is changing? There are many excellent resources on local, national, and global climate change indicators and projections for the future. Here are a few we recommend checking out.
Local and Regional Climate Data
National and Global Climate Data
Interested in learning more about how our climate is changing? There are many excellent resources on local, national, and global climate change indicators and projections for the future. Here are a few we recommend checking out.
Local and Regional Climate Data
- Get your weather forecasts with a climate context
- Learn more about the connection between wildfires and climate
- The American Lung Association Rankings: Check out how Missoula's Air Quality stacks up
- Explore the Montana Climate Atlas
- Check out the Montana Drought Monitor and the Montana Drought and Water Supply Index
National and Global Climate Data
- Learn more about Climate Change Indicators in the United States - from snow and ice, to ecosystems, to weather and precipitation
- Dive in to the most recent National Climate Assessment
- Take a look at the Climate At A Glance from the National Oceanic and Atmospheric Administration
- Get the 30,000 foot view: NASA's Vital Signs of the Planet
- Explore climate change projections based on different emissions scenarios
Sources:
Climate.Gov:
- https://www.climate.gov/news-features/understanding-climate/2014-state-climate-earth%E2%80%99s-surface-temperature
- https://www.climate.gov/news-features/featured-images/noaa-2016-summer-outlook-where-are-highest-chances-hot-summer-us
National Centers for Environmental Information:
- https://www.ncdc.noaa.gov/sotc/global/201513#gtemp
- http://www.ncdc.noaa.gov/temp-and-precip/climatological-rankings/
NOAA Climate at a Glance: http://www.ncdc.noaa.gov/cag/
Climate Central:
- More Rain, Less Snow as World Warms
- Western Wildfires and Climate Change
Montana Climate Office: http://www.climate.umt.edu/atlas/precipitation/default.php
Weather Shift: http://wxshift.com/news/graphics/western-wildfire-trends
American Lung Association: http://www.lung.org/our-initiatives/healthy-air/sota/city-rankings/states/montana/missoula.html#tabs-1
Environmental Protection Agency: https://www3.epa.gov/airquality/airtrends/2011/report/climatechange.pdf
City of Missoula Our Missoula Growth Plan: ftp://ftp.ci.missoula.mt.us/DEV%20ftp%20files/Projects/OurMissoula/GP_11_13_15_FULL.pdf
US Forest Service Fire Lab: http://www.firelab.org/
Missoulian: "Something in the Air: Study Finds Wildfire Smoke Problem Intensifies with Climate Change"